All important metrics in a single view
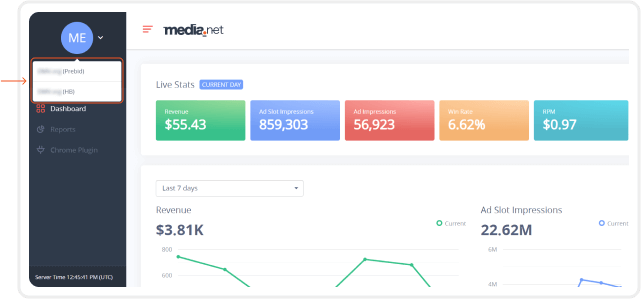
All important metrics in a single view
- Find a high-level snapshot of important metrics on the dashboard home-screen.
- Scroll down to analyze trends of key metrics over any predefined or custom time range.
Reports to monitor and optimize your account performance
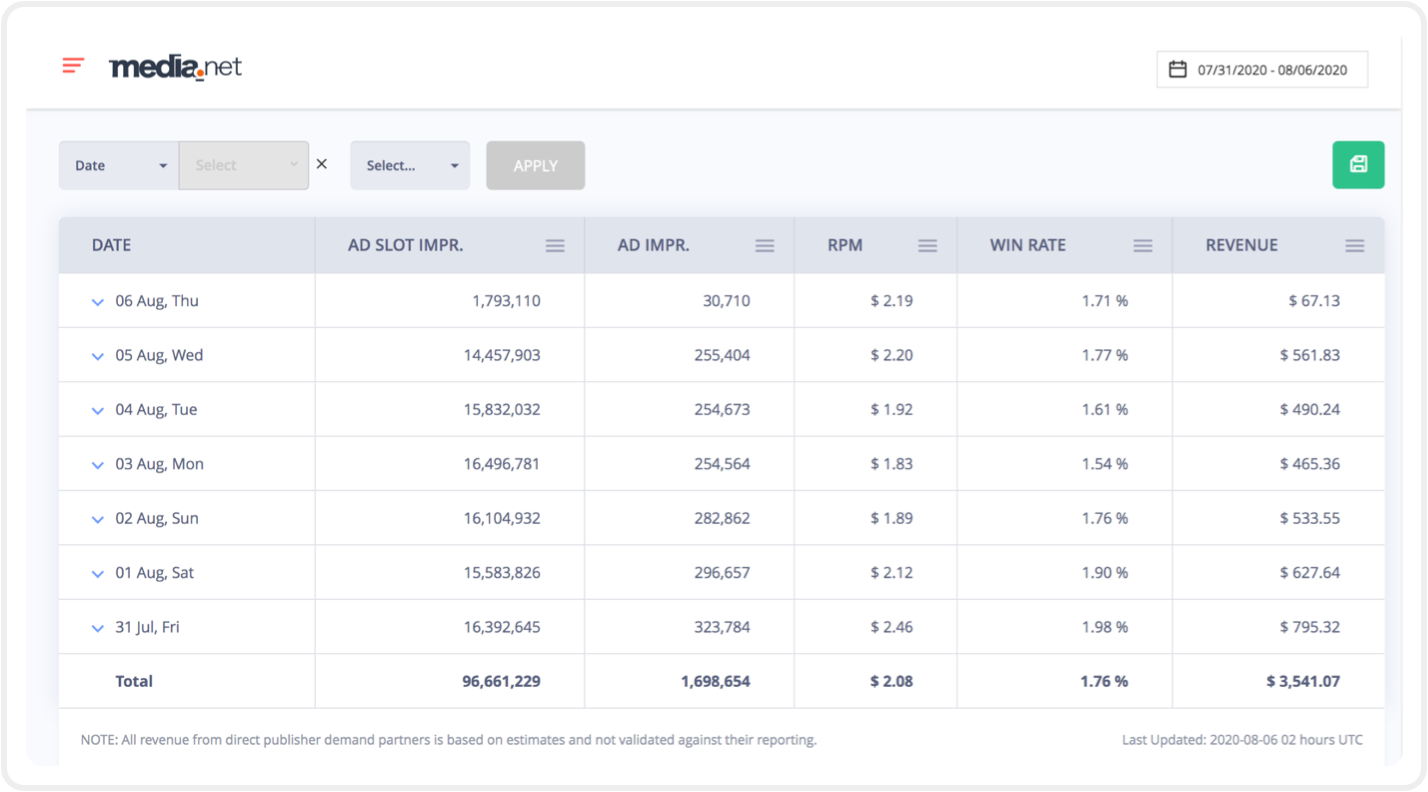
Generate in-depth Reports
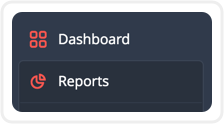
- Use the Reports section on the left panel to generate reports based on device, geographic location, domain, and more.
- Modify your reports by date from the top-right corner. Pick from an existing date range or input your own custom date range.
- Download all Unify reports in CSV format by clicking on the green icon on the top-right.
Deep-dive into data with multiple splits
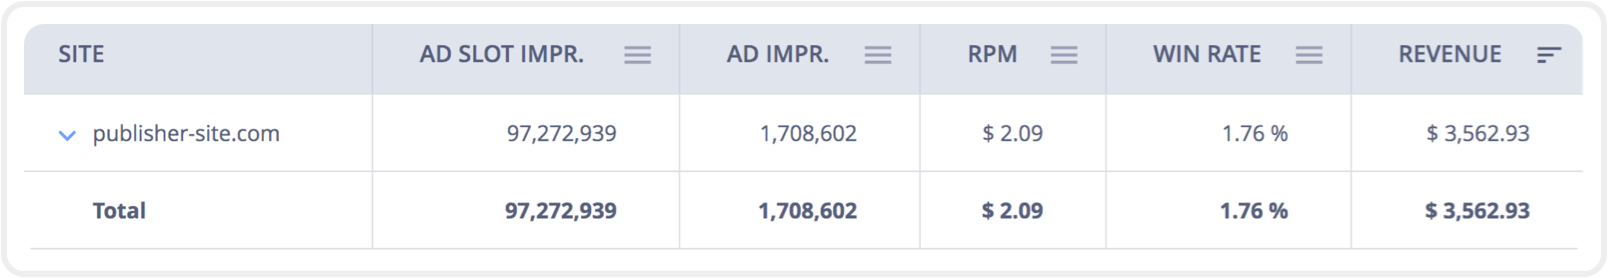
By Site
Detailed breakdown of ad impressions and revenue for every site in your publisher network.
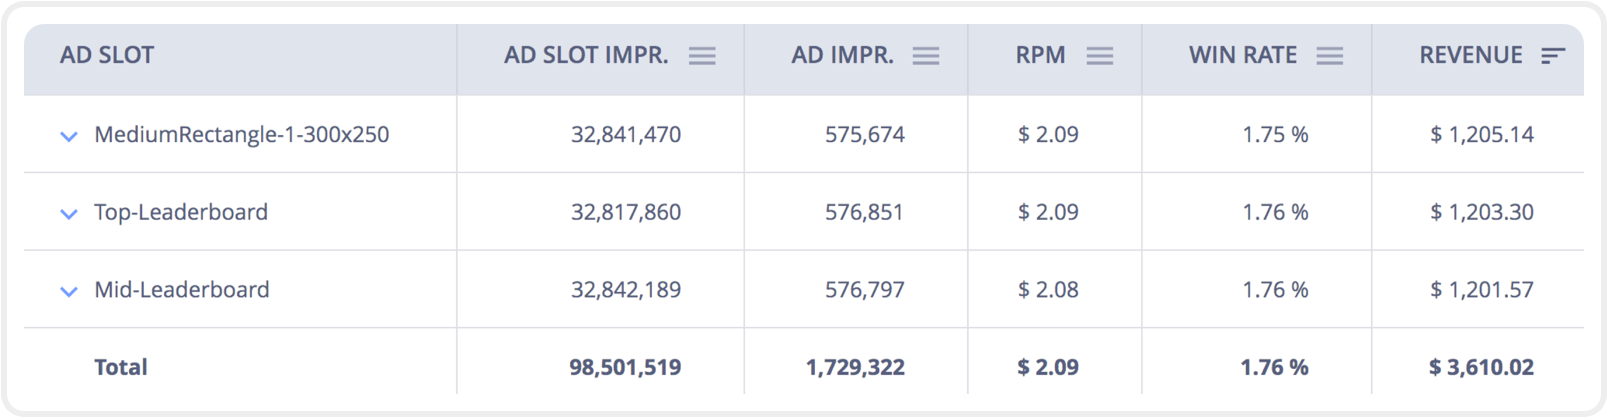
By Ad Slot
Leave no money on the table by ensuring top-performing ad slots get the attention they deserve.
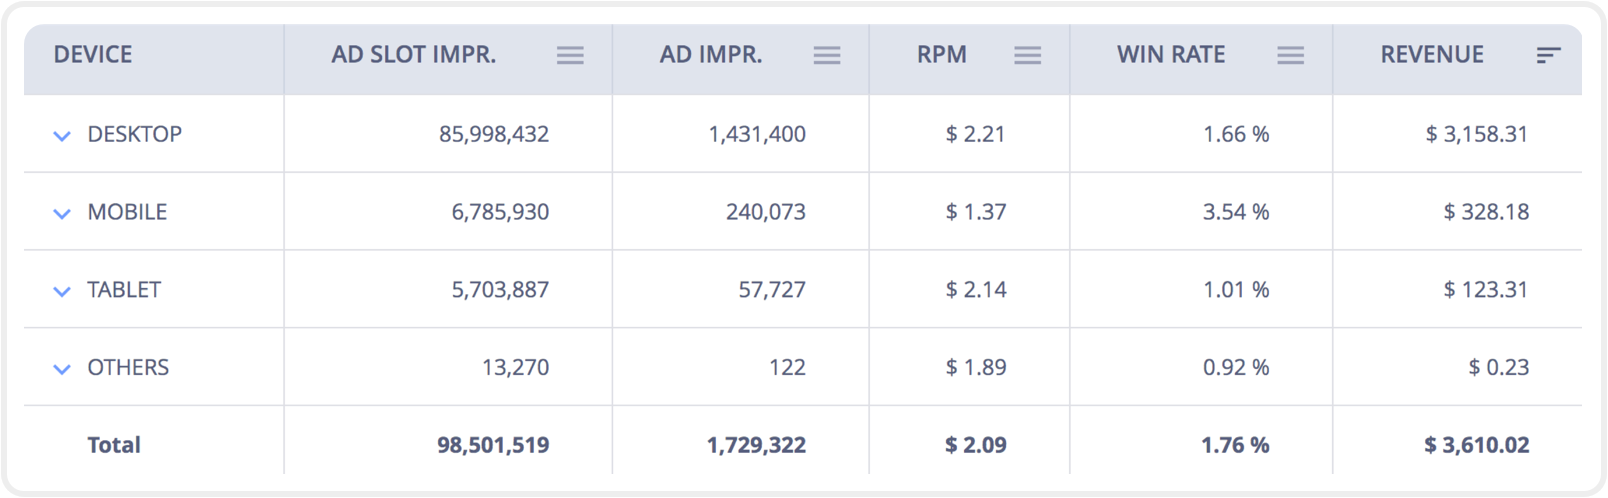
By Device
See which platforms are driving ad revenue and optimize accordingly to maximize ad revenue earnings.
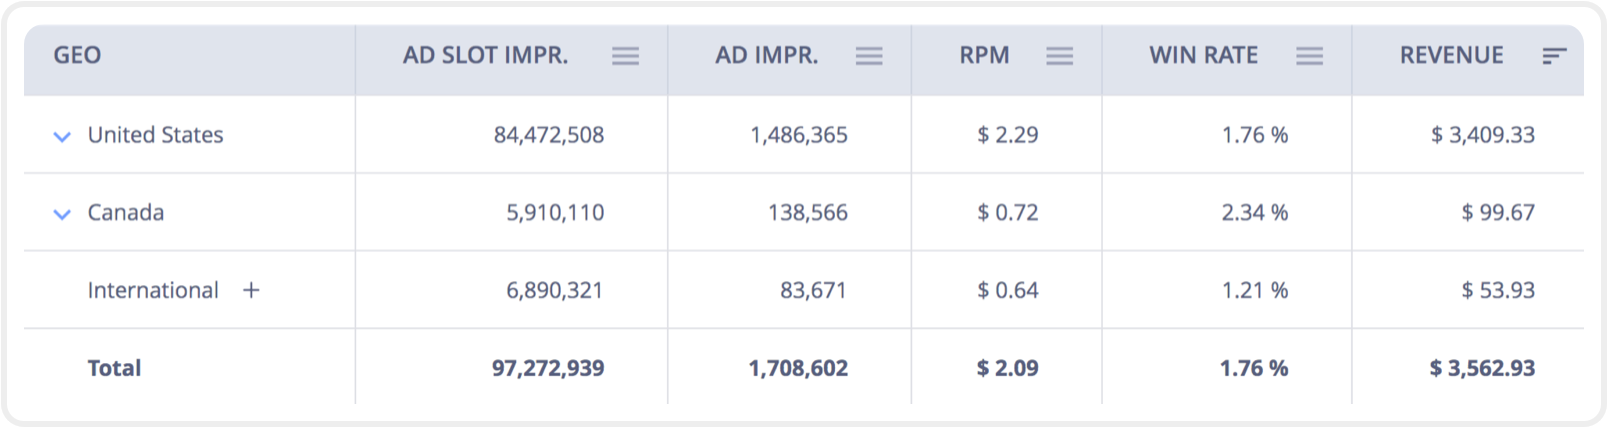
By Geography
Data split primarily between North America and other regions, with options for more in-depth country-wise splits.
Choose between merged
and comprehensive reports
Choose between merged
and comprehensive reports
- Break down revenue performance by integration type for comprehensive insights.
- Opt to view integrated, merged reports to get the overall picture.
- No need to login to multiple dashboards – track performance across integrations from one single dashboard.
Landscape view to visualize performance
and provide actionable insights
Check bidded impressions versus ad impressions or revenue, and break them down further based on geographic location, cookie details, or ad unit size.
Use the bid distribution slider to help you decide on floor prices, PMPs, and much more.
Schedule Reports with 3 easy steps
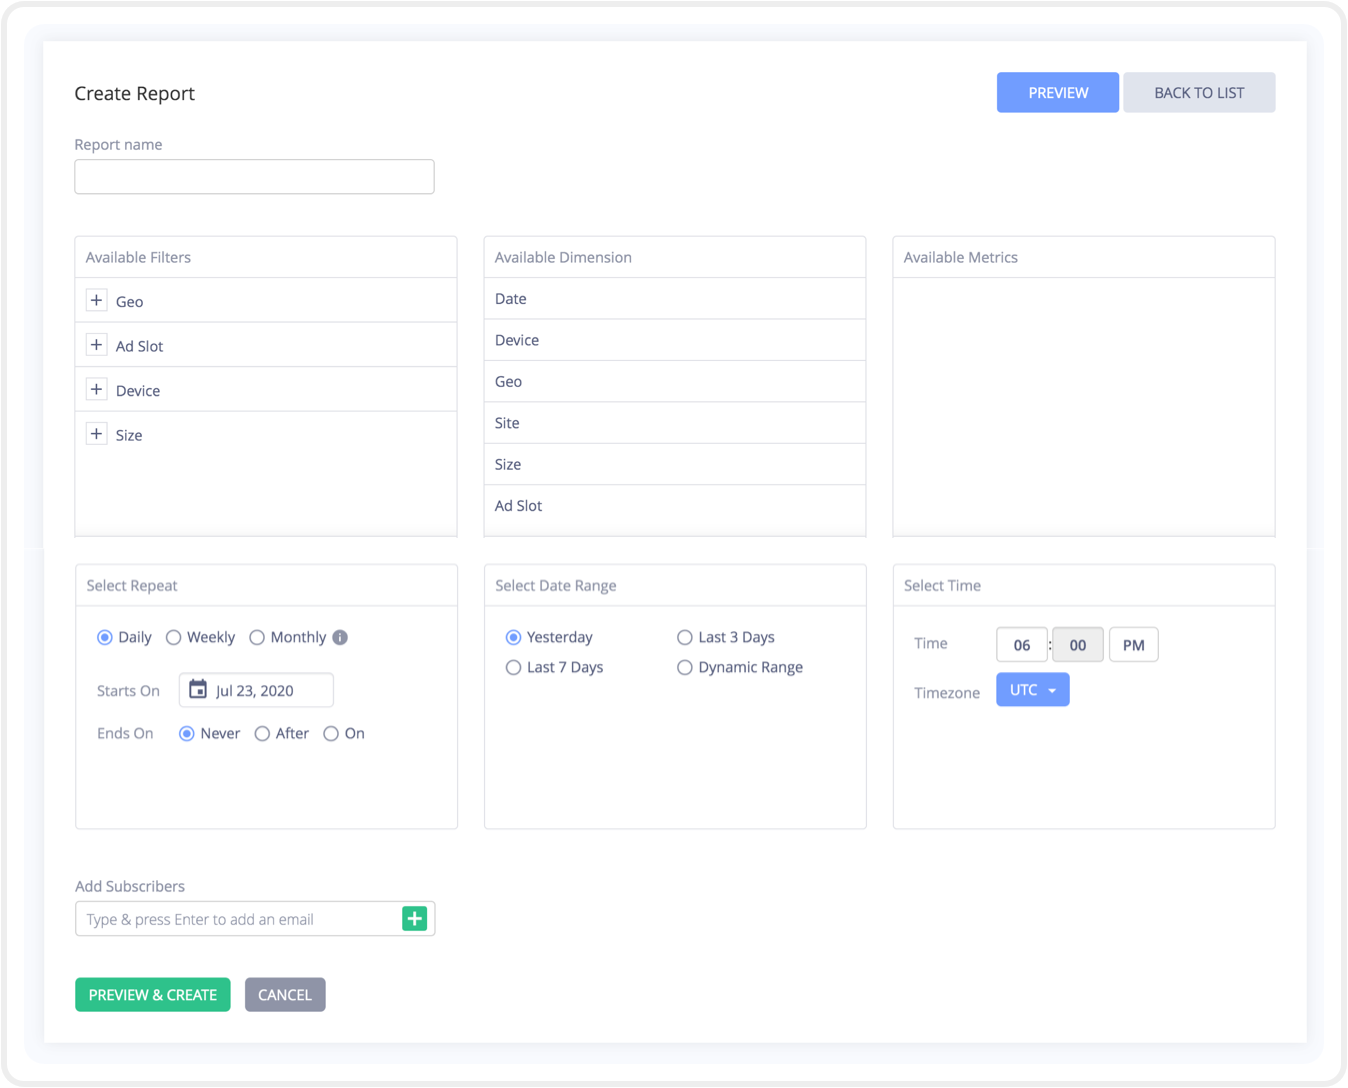
Schedule Reports with 3 easy steps
- Click here and give the new report a name, and select all the applicable filters and metrics.
- Choose how often you want the report to be created, what date range it should cover, and at what time you’d like it delivered.
- Enter the email address of all the recipients who will get the report. Your scheduled report is now ready to be previewed and created.
Payment information at a glance
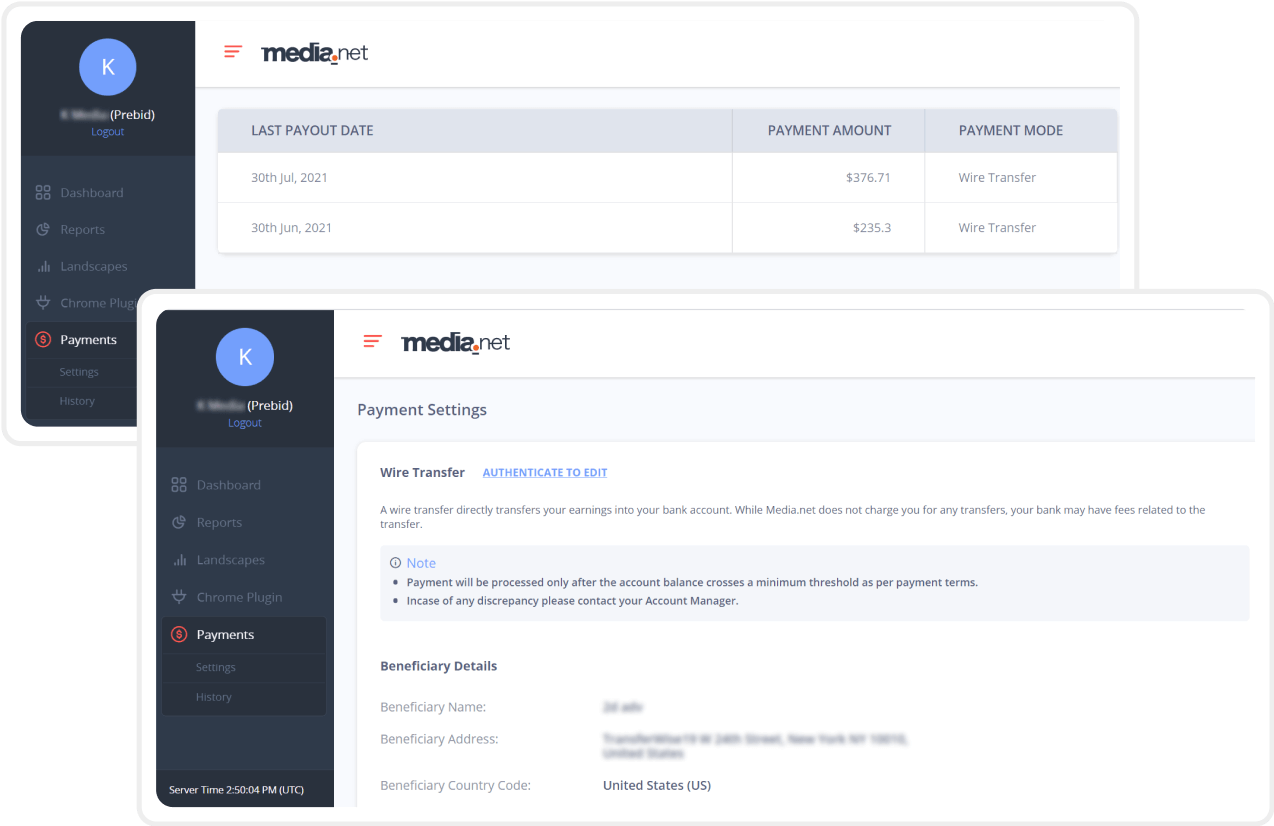
Payment information at a glance
- Set up and edit payment information with ease.
- Keep track of all your payout information, including payment cycles and payout status.
Ad-Tech is complex.
Media.net simplifies it for you.
Log into your Media.net Reporting Dashboard
at neo.media.net using your Media.net credentials.